

Clinical diagnosis
Case 13
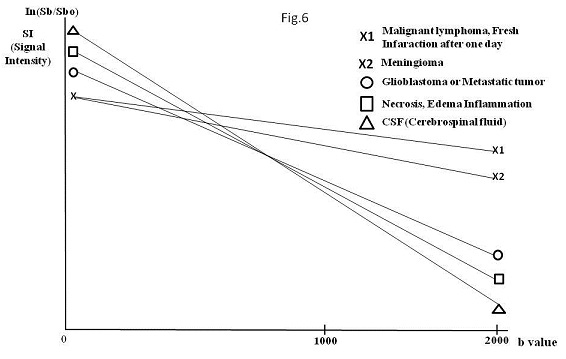
The diffusion data can be presented as signal intensity or as an image map of the apparent diffusion coefficient (ADC). Calculation of the ADC requires 2 or more acquisitions with different diffusion weightings (1). Namely, ADC of each tumor equals to the slope of the curve using the acquired signal intensity values of b0 and b1000 or b2000 (Fig. 6)(ADC = Loge Sb/Sb0)(2). An ADC map is drawn using the slope data of each voxel (2).
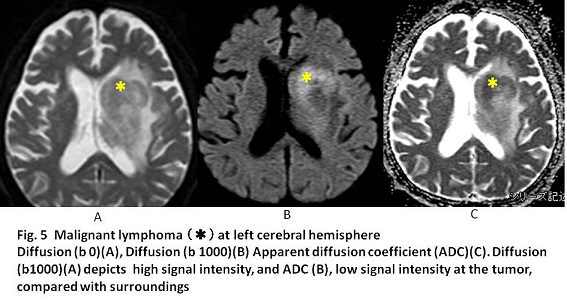
Diffusion b0 means the image before motion probing diffusion (MPD) and Diffusion b1000 means the image after MPD with b1000. In short, Diffusion b1000 and Diffusion b2000 indicates the image created by the acquisition data at MPD with 1000 and MPD with 2000, respectively (1, 2). The difference between Diffusion b1000 and Diffusion b2000 implies the higher b value brings about the prominent contrast, compared to the surroundings (Fig. 6): the tumor with the diffusion repression more markedly stands out in Diffusion b2000 than b1000 since the surrounding with the diffusion low-repression drops the signal intensity more significantly in b2000 than in b1000 (2).
The numerical value of signal intensity of each tumor (longitudinal line of Fig.6) is useless to evaluate the diffusion because signal intensity of b0, b1000 and b2000 are obtained by minute induced current and tuned by multiply with approximately one thousand (2). Then, signal intensity values are unreliable. ADC (the slope of the curve) is the relatively reliable for evaluating diffusion repression.
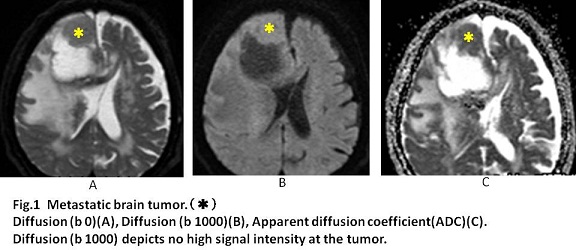
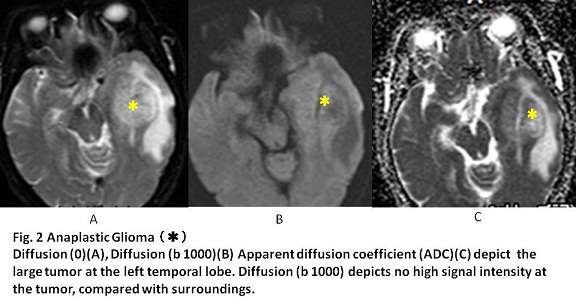
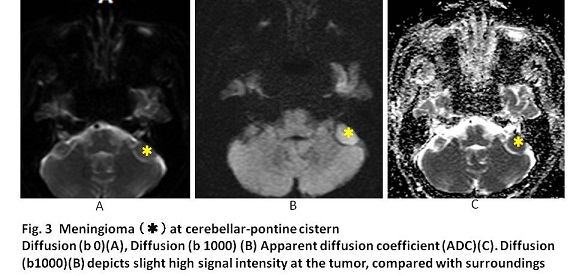
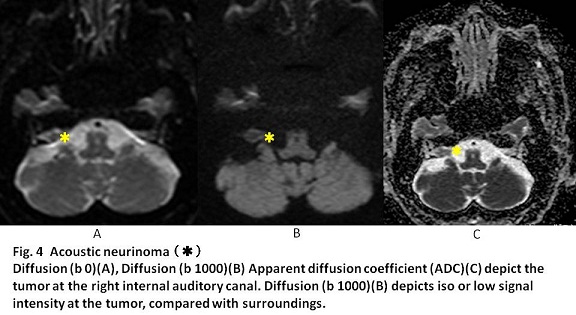
In the previous reports (3, 4) on comparing ADC among malignant lymphoma, glioblastoma and lymphoma, the mean ADC was significantly lower in malignant lymphoma than in glioblastoma and metastasis. Doskaliyev A, et al reported that the cutoff of ADC to differentiate glioblastoma from malignant lymphoma was 0.5 (10-3mm2/s at b4000)(sensitivity 90.9%, specificity 91.7%)(4). Further, ADC in meningioma is known to be lower than that in neurinoma (5, 6). Xu XQ et al. reported using ROC analysis that a cut-off value of 1.1(10-3 mm2/s at b1000) differentiating CP angle meningioma from neurinoma (AUC, 0.975; sensitivity, 100%; specificity, 88.9%) (5). In our cases, ADC of malignant lymphoma was 0.5(10-3 mm2/s at b1000), ADC of meningioma 0.7, ADC of metastatic brain tumor 0.9, ADC of gliobalastoma 1.1, and ADC of neurinoma 1.4.
【Summary】
The lower ADC implies the higher repression of the diffusion. ADC equals to the slope which can be calculated using the acquired signal intensity values of b0 and b1000. ADC is the reliable numerical value to evaluate the diffusion. Of the five brain tumors, ADC of malignant is the lowest (0.5 10-3mm2/s at b1000), followed by that of meningioma (0.7 10-3mm2/s at b1000).
【References】
1.Aoki S et al. Diffusion MRI 3rd edition. Syujunnsha 2013 (Japanese)
2.Kita M. Personal communication in Fuchu Hospital
3.Shim WH et al. Comparison of Apparent Diffusion Coefficient and Intravoxel Incoherent Motion for Differentiating among Glioblastoma, Metastasis, and Lymphoma Focusing on Diffusion-Related Parameter. PLoS One. 2015 30;10:e0134761. doi: 10.1371/journal.pone.0134761. eCollection 2015.
4.Doskaliyev A et al. Lymphomas and glioblastomas: differences in the apparent diffusion coefficient evaluated with high b-value diffusion-weighted magnetic resonance imaging at 3T. Eur J Radiol. 2012;81:339-344. doi: 10.1016/j.ejrad.2010.11.005. Epub 2010 Dec 3.
5.Xu XQ et al. Radiological indeterminate vestibular schwannoma and meningioma in cerebellopontine angle area: differentiating using whole-tumor histogram analysis of apparent diffusion coefficient. Int J Neurosci. 2016 Apr 6:1-8. [Epub ahead of print]
6.Sener RN, et al. Diffusion magnetic resonance imaging of solid vestibular schwannomas J Comput Assist Tomogr. 2003 ;27:249-52.
2016.7.6
COPYRIGHT © SEICHOKAI YUJINKAI. ALL RIGHTS RESERVED.