

Clinical diagnosis
Case 78
【Progress】He accepted the result of imaging diagnosis. Because he hoped to achieve his weight loss by dieting, he was willing to get advice and direction by our nutritionist.
【Discussion】
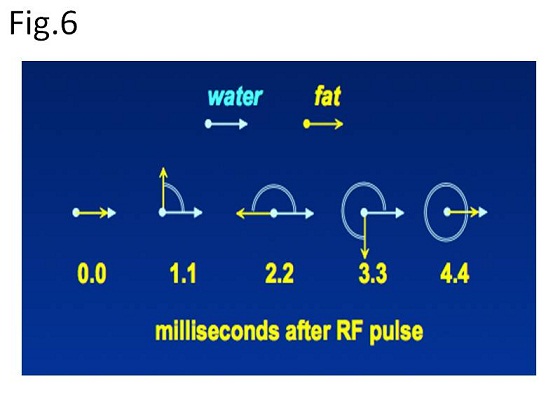
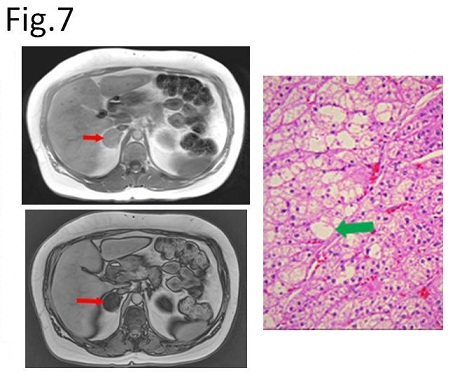
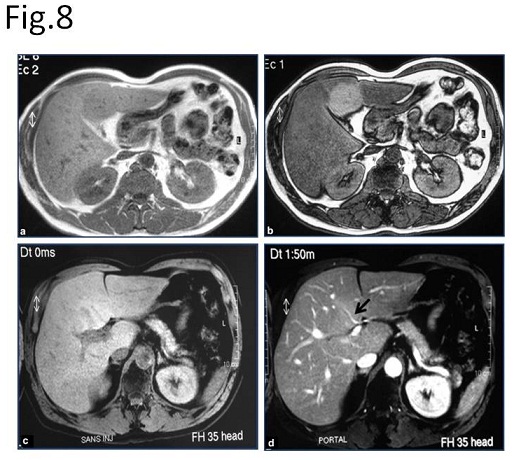
There are several different methods of suppressing high signal from fat on MRI. As one of these methods, Out-of-phase and In-phase imaging are obtained using paired gradient resonance echo (GRE) method with two different echo time (TE) (e.g. 2.3 msec, 4.6 msec) in order to investigate microscopic fat components of target organs. In short, resonance frequency of water proton is 63.870301 MHz and that of lipid is 63.870083 MHz at 1.5 T magnet field (1-4). The difference is 217 Hz which means that water proton does precession movement (cycling) is one time greater than lipid proton per 1/217 (4.6 msec ) sec. Namely, water proton and lipid proton face the same direction 4.6 msec after RF pulse and they face the opposite direction in 2.3 msec after RF pulse (Fig. 6). In- phase imaging indicates filming at the time when water proton and lipid proton face at their same direction, while Out-of-phase imaging does when they face at the oppose site. As a result, signal intensity of In-phase indicates signal intensity of water proton + signal intensity of lipid proton, while that of Out-of-phase indicates signal intensity of water proton – signal intensity of lipid proton. Thus, when water and lipid exists at the same degree in a component, the component is visualized as no signal. Actually, the boundary of visceral organ (e.g. liver and spleen) on Out-of-phase image is visualized as black line or bundle because of no signal that the same degree of water and lipid exists at the boundary (Fig. 3A). This technique is commonly used for the differentiation of adrenal adenomas from carcinomas and metastases, and fatty liver from liver tumors (Figs 7, 8)(1-4).
In our case, the lesion at the quadrate lobe was obtained by In-phase and Out-of-phase imaging using a pair of GRE with two different TE (2.3 msec and 4.6 msec) at the same repetition time (TR). The signal intensity of fat liver parenchyma decreased in Out-of-phase imaging, leading to identification of the fat-sparing lesion as iso-signal intensity or slight high-signal intensity (Fig. 3). Meanwhile, in In-phase imaging, signal intensity of the same lesion is almost the same signal intensity as surrounding fatty liver. Further, T2WI and fat suppression T2WI showed no evidence of space-occupying lesion in the liver (Fig. 4)
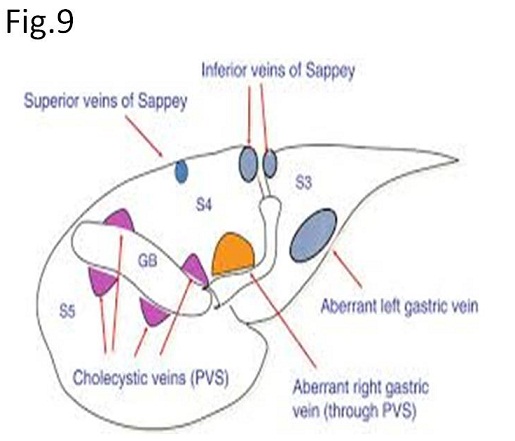
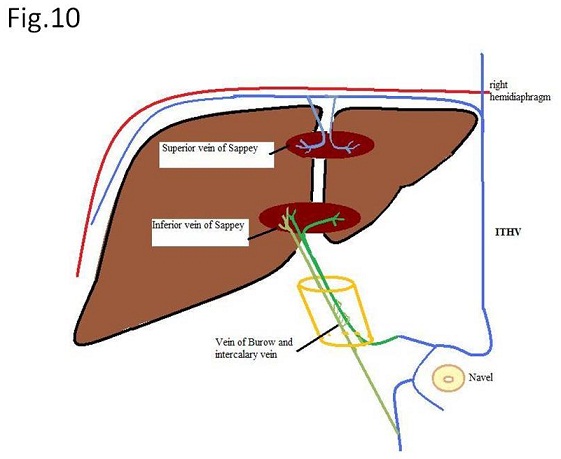
Pseudolesions of the liver are caused by aberrant hepatopedal venous drainage other than portal venous flow, known as the third flow (5-7). Third flow is known as aberrant right gastric vein, aberrant left gastric vein, paraumbilical vein (superior and inferior veins of Sappey) and cholecystic veins (Figs. 9, 10) (5-7). In our case, the pseudolesion is visualized in the dorsal side of the quadrate lobe, implying typical outflow site of the aberrant right gastric vein. Further, the aberrant right gastric vein was seen as a tiny vessel draining to the fat-sparing lesion on dynamic coronal enhanced CT (Fig. 2). Interestingly, hepatocyte phase of MRI using Gd-EOB showed mildly hyper signal intensity in fat-sparing area that is considered the fat-sparing area works to excrete more Gd-EOB than fat containing area.
【Summary】
We present a fifty-year-old male with pseudo-lesion of fat-sparing area in the quadrate lobe. Axial images of non-enhanced and enhanced CT using contrast medium showed slightly high density lesion and hyper-vascular lesion like hemangioma, respectively at the quadrate lobe of the fatty liver. Enhanced coronal CT image showed a tiny vessel (probably aberrant right gastric vein) draining to the hyper-vascular lesion. Out-of-phase image on MRI showed a hyperintense lesion corresponded to the pseudo-lesion because fatty liver surrounding fat-sparing lesion decreased signal intensity. We should keep in mind that Out-of-phase shows hyper-intense signal intensity when fat-sparing area occurs such as our case, while hypo-intense signal intensity comes out when focal fat deposition occurs. Irrespective low or high signal intensity of pseudo-lesion on Out-of-phase, T2WI and fat-suppression T2WI is useful to differentiate pseudo-lesion from true lesion.
【References】
1.Outwater EK, et al. Detection of lipid in abdominal tissues with opposed-phase gradient-echo images at 1.5T: techniques and diagnostic importance. Radiographics 1998; 18:1465-80.
2.Dixon WT. Simple proton spectroscopic imaging. Radiology 1984; 153:189-194.
3.Glover G. Multipoint Dixon technique for water and fat proton and susceptibility imaging, J Magn Reson Imaging 1991;1:521‐530.
4.Reeder SB, et al. Iterative decomposition of water and fat with echo asymmetry and least-squares estimation (IDEAL): application with fast spin-echo imaging. Magn Reson Med 2005;54:625-635.
5.Matsui O, et al. Pseudolesion in segment IV of the liver at CT during arterial portography - correlation with aberrant gastric venous drainage. Radiology. 1994;193:31–35. [PubMed]
6.Yoshimitsu K, et al. Anatomy and clinical importance of cholecystic venous drainage: Helical CT observations during injection of contrast medium into the cholecystic artery. AJR Am J Roentgenol. 1997;169:505–510. [PubMed]
7.Terayama N, et al. Focal sparing of fatty liver in segment II associated with aberrant left gastric vein. Br J Radiol. 2004;77:150–152
2017.11.1
COPYRIGHT © SEICHOKAI YUJINKAI. ALL RIGHTS RESERVED.